Trading Edges That Last
Market Commentaries
Online Series
- You May Also Like
 What I posted last weekend based on my proprietary custom breadth analog model: The full post can be found here. Well, what happened this ...READ MORE
 Review of Forecast for Jan 18, 2016 Custom breadth extreme on Wednesday produced the expected rally back up to near the 3.5% projection. Premium members were told to watch out for ...READ MORE
 S&P 100 (OEX) is a subset of the S&P 500 Index containing the top 100 most valuable companies within the S&P 500. This index has long been used for the ...READ MORE
 Advance / Decline Issues Bull Charge is a day trading model based on real-time advance / decline issues only. It is not only a very consistent mechanical trading model. It ...READ MORE
 An update to my post back in mid-September pointing out that a market breadth driven correction was on the way. Here are the updated custom market breadth charts for ...READ MORE
 It is time to take a look at the basic statistical behaviour of the Tick Index. Following is a chart of NYSE Tick Index and its 3 distribution graphs. ...READ MORE
 Review of Forecast for Feb 8, 2016 Everything unfolded as expected - bounced from a flush low early last week, weaknesses kicked in after Wednesday and limited upside cap by the ...READ MORE
 Review of Apr 6, 2015 Monday gap down capped by 1% drop and it led to a mega run all the way back up to +1.5% from the prior week close. ...READ MORE
 Someone asked what I mean by “custom tick divergence” in my real-time commentaries. Here are 5 charts (one day each) for the past week with Emini S&P, $Tick index and ...READ MORE
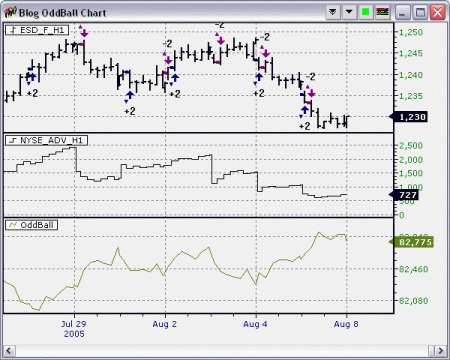
 OddBall is created by Mark Brown, and was featured in Active Trader magazine. It is a trading system designed for trading the S&P index future (or the emini counterpart). The ...READ MOREProud of My Model Calling the Pullback NovS&P500 Short Term Market Breadth Analog Forecast StartingMarket Breadth Primer: S&P 100 Historical Constituents ChangeMarket Breadth Primer: Advance / Decline Issues BullMarket Breadth Correction Progresses To NeutralTrading with Tick Index: Know Its PersonalityS&P500 Short Term Market Breadth Analog Forecast StartingS&P500 Short Term Market Breadth Analog Forecast StartingTrading with Tick Index: Tick1K and its DivergenceOddball System – An Update
 Search
As Featured In


Market Internals 2013-02-17
My monthly update on market internals.
The current snapshot of S&P 500 3-Day Advance Issues, Tick16 Short Term + Long Term as of 2013 Feb 17 close.
Reading
1. Long Term Tick16 (yellow line) below neutral zone but not dropping
2. Short Term Tick16 (red line) pulled back to neutral zone
3. 3 Days Advance Issues (green line) diverging from new high printed by S&P itself
Inference
a. #1 in bearish consolidation mode. That means 30-min timeframe intraday has no continuation strength. Both overbought and oversold on 30-min and up would result in reversal easily.
b. #2 points to breakout mode as the index has compressed at neutral zone for days.
c. #3 points to a pullback in breadth (advance issues) back down to neutral zone is necessary. It can correct itself without dragging the price of S&P lower. If so it will be very bullish for S&P.
Last update predicted it was still in favour of the bulls and every push lowered were good long opportunities. That was indeed what happened. This may change if #1 starts to slide lower away from the neutral zone into more bearish level.
Share