Trading Edges That Last
Market Commentaries
Online Series
- You May Also Like
 Review of Forecast for Aug 22, 2016 No 1% move in either direction led to range bounded actions, so 2% breakout play not triggered. Slingshot move materialized. Short term breadth sell ...READ MORE
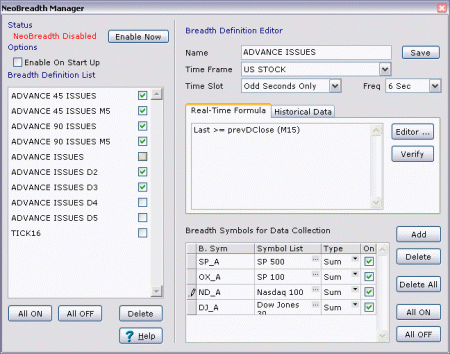
 NeoBreadth enables our users to collect user defined breadth data within NeoTicker, both in real-time and in reconstruction of historical breadth data. The analysis of customized market breadth data is ...READ MORE
 Monthly update on market internals. The current snapshot of S&P 500 3-Day Advance Issues, Tick16 Short Term + Long Term as of 2013 July 19 close. ...READ MORE
 Review of Apr 6, 2015 Monday gap down capped by 1% drop and it led to a mega run all the way back up to +1.5% from the prior week close. ...READ MORE
 The current snapshot of 3-Day Advance Issues, Tick16 Short Term + Long Term as of 2012 Jul 24 Close. Readings 1. 3-Day Advance Issues printing new low with S&P at the same ...READ MORE
 Stock market indices are calculated from a basket of components. These components, however, are not always the same. Components are changed for many reasons. Contrary to what many conspiracy theorists ...READ MOREHaven't got time to write an update til now. The sell off I was looking for til 3-day advance struck bottom was done in the beginning of last week. Not quite ...READ MORE
 An interesting usage of advance / decline issues is to identify the market extremes. Here is one setup that has emerged as one of the best short term bottom picking ...READ MORE
 The market internal updates is turning into a monthly update ... First I was told that I need to post the chart here so that there is a reference to what ...READ MORE
 Review of Forecast for May 23, 2016 Short term oversold conditions in custom breadth lead to breakout of the bull flag on daily chart. Down trend broken off previous week close. ...READ MORES&P500 Market Breadth Driven Short Term Forecast StartingAdvance Issues Pattern 1Market Internals 2013-07-21S&P500 Short Term Market Breadth Analog Forecast StartingMarket Internals 2012-07-24Market Breadth Primer: Component Changes And Their EffectsMarket Internals 2011-11-07Market Breadth Primer: Advance / Decline Spike LowMarket Internals 2012-06-17S&P500 Short Term Market Breadth Analog Forecast Starting
 Search
As Featured In


Market Internals 2013-06-20
Monthly update on market internals.
The current snapshot of S&P 500 3-Day Advance Issues, Tick16 Short Term + Long Term as of 2013 Jun 20 close.
Reading
1. Long Term Tick16 (yellow line) well above neutral zone heading down
2. Short Term Tick16 (red line) moving down towards oversold area
3. 3-Day Advance Issues (green line) sold off down to new low together with S&P
Inference
a. #1 is bullish pointing to selloff should be bought
b. #2 points to a short term bottom is coming soon
c. #3 4th lower low matching the S&P points to a complex low in the making
Last update I was looking for a top that will lead to significant correction. We have that in progress now.
This corrective move in ES has not produced a bearish trend in 3-Day Advance Issues or TIck16 which implies another important swing low is in the making.
To time the swing low focus on Tick Index based divergence over a 2 to 3 day period to identify the potential bottom. Another sign to look for is that 3-Day Advance Issues would stay at the bottom for several days creating a powerful setup to squeeze S&P higher.
Share