Advance Issues Momentum – An Update
I have written an article called Advance Issues Momentum published in the Technical Analysis of Stocks and Commodities magazine, August 2004 issue. Here is an update about this interesting indicator.
The Concept
Advance Issues Momentum is a breadth indicator. It is calculated by taking the number of components having positive N-day momentum. The original article used 5-day momentum as the basis for its presentation.
Dow Jones Industrial Average and its 30 components were used in the article as an example to show how the index correlates to AIM.
Here is the indicator written in Delphi Script, AIM Indicator. After downloading the script into your local harddirve use indicator manager to install the script file before you can use it.
Techniques Applicable to AIM
Due to the fact that AIM is a form of momentum indicator, it works great as a leading indicator when there is divergence between the price formation and its AIM counterpart.
Trendline works well on AIM. You can draw trendlines from peak to peak, or trough to trough for the identification of trend.
Using AIM as an overbough/oversold (OS/OB) indicator could be viable as it is a perfectly range bounded indicator. Since I have not done enough research in this area, I cannot tell how accurate it is using AIM in this manner.
Indicator vs NeoBreadth Approach
The original article focuses on an indicator approach, which can be adapted to software other than NeoTicker.
When you set up the chart, you need to load the index data (or the index future) or whatever you are going to compare against, into the chart, together with all the components loaded into the same chart. Then adding AIM indicator to the chart will have it calculated correctly. If you find the chart is too crowded, you can always hide the components without affecting the calculation results.
The advantage of using the indicator approach is that it is great for investigative work on multiple baskets. Once the chart is set up correctly, you can easily change the basket of symbols to anything you want. In short, you just delete all the components (with the press of just one button) and then replace that with a new basket of symbols (with the press of another button). You can then check out the results immediately.
The weaknesses to this approach is that it does not handle the historical change of components within the basket at all. Thus, leaving the historical evaluation of the indicator less accurate as it is not refering to the correct components during different historical time periods.
For example, HD, SBC, MSFT and INTC are not part of DJIA until November 1999. Thus, the indicator version of AIM even though can plot all the way back in history, that does not really represent what the indicator should look like at that point in time as the components before November 1999 is different.
Well, we have to put this into proper perspective though – having just one component switched probably will not change the behaviour much, but we are talking about 4 out of 30 components being changed on the same day, that is significant as it can easily swing the AIM indicator 10% in either way.
The issue of component changes lead to another interesting issue I have observed for many years on tracking various index driven breadth models. The bigger the basket, the less likely a few component changes can affect the breadth data drastically. But if you do not update your basket to match the new components within a month or so, then, the new changes will catch up with you due to the fact that most index funds and index tracking instruments would have completed their transition within a month. In short, the workload of maintaining a bigger basket is about the same as maintaining a small basket of symbols because you can update your bigger basket less frequently while for a smaller basket, you have to pay attention to the changes more frequent ly.
To properly handle historical data and adapting to the change of components, the best solution is to use NeoBreadth to collect AIM. That way, whenever there is a component change, all we have to do is adjust the symbol list and NeoTicker will take care of the rest.
Using NeoBreadth also makes it possible to construct the historical data with the correct set of symbols for a particular historical period, allowing the most accurate account of the breadth data to be generated.
The System Setup
We presented two (2) interesting breadth patterns based on very simple principle in the original article.
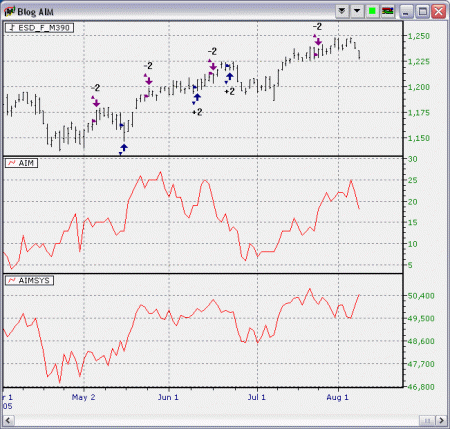
The buy signal – when AIM is dropping 2 days in a row, then bounce back just a little, leaving enough room for continuation to go up.
The sell signal – when AIM is rising 2 days in a row, then drop a little, leaving room for continuation to go down.
Here is the system written in formula, AIM System . Use the indicator manager to install the downlaoded system script into NeoTicker before you can use it.
How does it look like on a chart? Here it is,
Performance
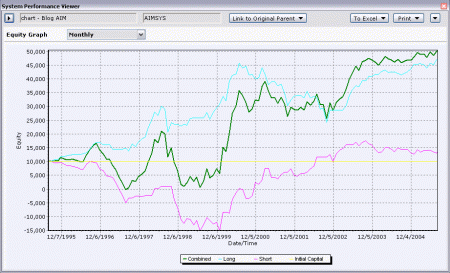
The historical performance is not accurate before November 1999 due to the change of components at the time.
At the first glance, it is obvious the system is not a steady growth model. It pretty much goes sideway for a long period of time before jumping into the next level of equity. Each jump in the system equity is very explosive and does not correlates to the underlying data’s direction, which is a very good sign.
Analysis of the System
Using very specific pattern as turning points could missed many possible turns, including good turning points. That is the main weakness of this system. If a more general approach to the turning point is used, the system will probably perform more steadily with less drawdown.
After the original article was published, the system is still performing fine a year later, although the growth rate is slow, it is already much better in comparison to other well known breadth based models. That proves the merits of the AIM concept.
There are a few possible areas to improve the system,
1. Seek for a better, more general set of signals to trigger buy and sell. That way the system will not suffer from the unnecessary draw down that it has experienced.
2. Better money management rules should be added because the original system presented does not even have money management rules.
3. Modify the system to daytrade only, that way the short term bias of the entry signals will not be affected by the following reversals that are not accounted for by the original signals.
Summary
In the original article, there is not enough room for the discussion of the strength and weaknesses of the AIM indicator. I think I finally got the chance to detail the various important issues related to the indicator and the trading patterns presented in the original article.
When we have time, we’ll publish more usage techniques on this indicator.


