Basic Tape Reading – The Importance of Sub-minute Charts
Most beginners in trading heard about the concept of tape reading. Unluckily, there is not much materials available that explains it in details. I hope I can provide some guidance here for our readers to learn the basics of tape reading.
What is Tape Reading?
Tape Reading is the study of raw price actions down to the finest resolution – where each trade occurs and where all possible bid/ask updates are monitored.
The term tape comes from ticker tape, print out by the ticker tape machines available since 1870s which reports the latest trade/bid/ask update information.
Nowadays, if you think about it, such information is very hard to interpret due to the fact that the amount of data to process is huge. This concern alone makes tape reading something mystical and sometimes even regarded as born with talents because many well known professional traders are famous for their tape reading skills.
By reading the tape properly, a trader is supposed to be able to tell if the market is weak or strong. This extra information is critical for trading, especially useful when you are daytrading. Just think, if you can identify the strength of the market you trade correctly 90% of the time, you will be able to take advantage of that to wait and buy at bid (when the market is weak), or sell at the ask (when the market is strong). That along will improve your trading performance drastically.
Basic Tape Reading
1. Do not look at the tape all the time, focus on the tape only when the market is closing in at critical price levels (previous day high, previous day low, pivot point, etc.).
2. Best is looking at a depth window with the current bid ask listed at the top, next is watching the quote window with the best bid and ask at the side. Using time and sales window to read the tape is not recommended.
3. Learn to identify 2 distinctive behaviours – a. when the market is moving in a particular direction, is there a lot of resistance. b. when the market is charging a particular price level, is it taking out that price level decisively.
4. Learn to identify a third state – the market is confused.
Some Useful Hints at Learning Tape Reading
When a price level is a strong resistance, the asking price will keep reappearing again and again even though the price got taken out a few times.
When a price level is a weak resistance, the price will be taken out decisively (sometimes after struggling for a short period of time).
A confused market will usually rally to a particular price point and then drop suddenly to a lower but close by price level. The market will then struggle between the two price levels. That implies a confused market and it is not likely you can figure out the direction of the next big move. In this case, stay at the sideline.
Having huge size in the bid does not necessarily means the bid is strong. On the other hand, when a bid got hit and trades started to fill at the bid, while the bid size keep increasing, that is a strong bid.
Tape Reading is Not Fool Proof
Tape reading is a useful technique but it is not 100% correct all the time. Thats true especially when some major players are hiding their bids and offers.
When the buy side traders are scaling into a position (i.e. buying at the bid while the price is dropping, or vice versa) it is then very hard to identify the strength of the market. That will usually results in V-shape reversal price pattern.
A Transitional Tool – Sub-minute Chart with Volume
For a beginner in tape reading, it is very hard to remember the price actions at a particular price level, say, 3 hours ago. Thus it is useful to have a N-seconds chart handy so that it can remind you the price actions you were tracking.
Using a raw N-seconds chart with volume, you can see the price actions clearly together with the volume that stands behind the price moves. For some people like me, adding a stochastics to the chart will help identifying the swings within the chart.
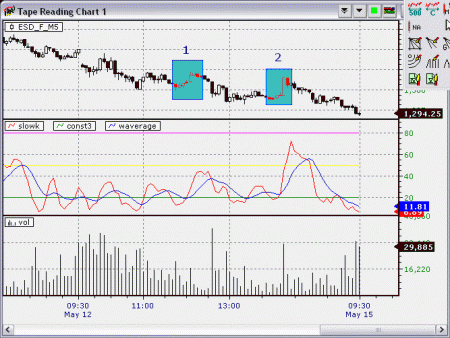
Following is a 5-minute chart with 2 failed stochastic divergence setups.
Lets look at #1, the first divergence setup that failed.
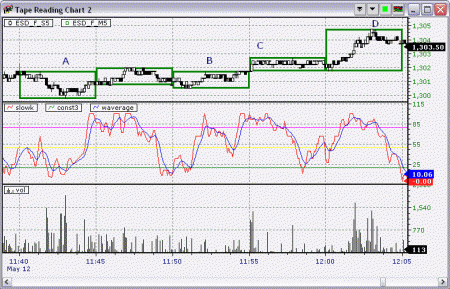
I am going to comment on the various periods within the chart,
A. Entrance price area.
B. First attempt to take out the initial rally started from A.
C. A normal breakout that consolidate at the price level it just created and sit there close to the new high.
D. Another breakout that really advanced the price level. Unluckily the stochastics is warning us that the rally is not as strong as we hope for (due to the divergence formation together with declining volume). Even if we are not taking profit at this level, it is important that we place protective stops to protect our long position.
Without tape reading, it is obvious that we will have to sit through our 5-minute chart setup and then there will not be enough time for us to bail out of this position.
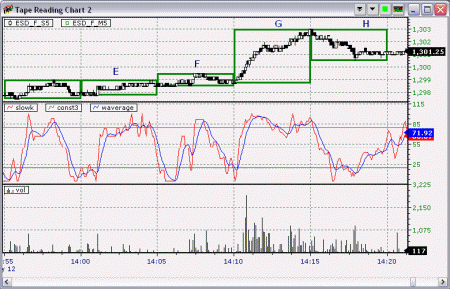
The next chart is a zoom in on the price actions of #2.
E. Entry price level
F. First attempt to go higher. Notice how the reaction is in terms of the sell pressure comparing to the support we get.
G. Second attempt to go higher that has real volume supporting the run up. Notice how the volume declined quickly.
H. If the rally has real strength, then we should see some support showing up here. It is a time of caution in case we are long, it is best to take profit and placing protective stop to protect the profits we made in the rally.
Again, by using a higher resolution chart (getting us closer to reading a tape), we are able to identify weaknesses in the 5-minute chart setup that we are trading. Thus we have an early warning sign that we can make our decision earlier and probably save us part of the profit.
Summary
Tape reading is not as hard as it seems. It is all about monitoring the price action and have a feel of the market strength.
Given enough time to practice, I believe everyone can learn and benefit from tape reading.


About 7’ish years ago I was using footprint charts on N225 and found it semi-useful. I’m considering exploring this area again, but on HSI. Maybe my experience over the years has changed my perspective on this type of analysis. I wonder if you have any comment on the usefulness of this type of analysis and its effectiveness as a sentiment tool in thin markets like the Hang Seng.
With thanks in advance,
MK
I tested footprint concepts on Nikkei and result is not that outstanding.
For HSI, I wonder if the limited # of issues in the index would be impacted more by a few leader stocks over the other ones. i.e. footprint of the leaders could be more useful than the footprint of the index itself
Practically speaking, I learned first hand from the other side of this industry how they move stocks in Hong Kong. It has always been media campaign with all out market cornering actions. Hence whenever the crowds are pushed to one side, it almost always resulting in very bad outcomes.
Over the last couple months I have been tracking the 6 highest weighted stocks in a regular chart and have been very surprised how out of sync they can be with the index. It surprised me because these 6 weight nearly 50% of the total index. I’m trying to find an execution edge that can lower my risk so that my R/R is increased. That is why I was thinking (probably erroneously) that getting down to the details of T&S analysis might help.
Whoa – could you expand more on the other side with regards to HSI? I cannot fathom how come the HSI moves as such, and with such vigor.
I have to word this carefully …
Eons ago when I was having a hedgie managing gig with clients from Asia, there were people from the “power brokerage houses” back then that can rally all kinds of help from the media – newspapers, TV shows, internet, etc. to talk about certain stocks.
It can be blue chip or junior, does not matter.
A compaign like that will bring up the activity with the stock and then something funny would happen. Those who are not informed would speculate all kinds of things about the stock of “interesting activities”. Rumors spread like wild fire.
The rest is the expected outcome where the original objective is met – be that pump and dump or unloading by the ultra rich.
The experience helped me isolated the pattern in unusual activities which is very often preceeding the volume breakout.
Very educational because I thought I was good. And they can do even better because they can truly manipulate the minds of the mass.
Really good post LC and interesting to read about from a first hand account such as yours.
Because HSI can move with such vigor, and at times so extreme directionality, what I wonder the most from a day trading perspective or even current day bias perspective is …. on HSI, is order flow (T&S on a footprint chart for example) enough to generally bias yourself with the right side of the market?
I need a way to asses to the way the current day is trading and align with it. During this recent drop, too often the day was up but I had no good references to get long. It highlighted a weakness to my approach I feel.
The most valuable signature is “non-confirmation” in breadth.
It is a common “sickness” in Asia that there are way too many “tips followers” who followed the bad tips.
Footprint is just an accumulated of volume with no classification. It is not reliable.
A good case in point is back in 1998 after the Russian crisis my bias turned ultra bullish, but obviously the last few days before the turn we see “wash out” actions across the board in US. There is no level on individual stock that can be deemed as safe, but the aggregated level on the indices are defended.
We are witnessing a very unique period just like the past major juncture now.
Worked out like late 1998 we get a bulltard run for another year across all the indices. Going otherwise it will be a 87 / 29 style crash. That’s why it is difficult to trade. It is not because what you know is not enough, it is because we are dealing with an inflection point that happens probably only once in 100 years.