Explosion in Emini S&P Trade Volume

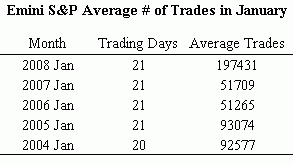
The table is showing the average number of trades per day in January over 5 year period. Back in 2004 and 2005, the average was around 90K and then decreased to around 50K in the following 2 years. This year, however, we have witness the biggest increase in emini trading activities.
What does this mean to you? Check out this article and be prepared.


