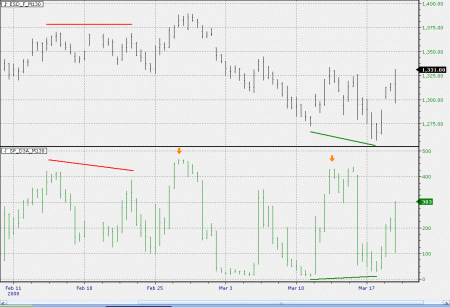
S&P 500 3-Day Advance Issues
I wrote an article on the concept of 3-Day Advance Issues in the Futures magazine – Using market breadth in trading systems, in the January 2008 issue. As oppose to repeating what was written in the article, I will focus on the discretionary aspect of this particularly interesting breadth data.
What is SP_D3A?
3-Day Advance Issues is a custom designed breadth data that collects the number of components that are closing higher than the close from 3 trading days ago, within a basket of symbols.
SP_D3A is the 3-Day Advance Issues breadth data I’ve collected in real-time on the S&P 500 components.
How to Use SP_D3A?
SP_D3A can be treated as a range bounded momentum indicator. Its range is from 0 (no issue is higher than its respective close from 3 trading days ago) to 500 (all issues are higher than their closing prices from 3 trading days ago).
An example of range bounded momentum indicator is stochastics which range from 0 to 100.
The strength of any range bounded momentum indicator is that they are, well, range bounded. Extreme readings are easily identified and can be quantified if they have any statistical bias in terms of price predictability.
The strength is also the main weaknesses, as extreme readings may last a long period of time before they revert back to more normal level.
Following is a chart of Emini S&P (ES) wtih S&P 500 3-Day Advance Issues.
Example 1 – Divergence
Look at the red lines. A clear divergence of lower highs in SP_D3A vs double tops in ES results in a steep decline.
Look at the green lines. This divergence of higher lows in SP_D3A vs lower lows in ES results in a dramatic reversal of the index.
Example 2 – Extreme reading
The orange down arrows are marking extreme readings in SP_D3A. In both cases ES retreated significantly.
Summary
SP_D3A is one of my most trusted indicators over the past 10 years, for both daytrading and multiple day swing trading directional bias.
One important point about using SP_D3A is that you have to remember that S&P 500 is a stock market index. It likes to top over a period of time, and then drop fast and hard suddenly. When it makes a bottom, however, sharp reverse is more common than a steady slow rise.


